Pretreatment Collateral Status Predicts Malignant Stroke Evolution in Patients Undergoing Endovascular Thrombectomy
Article information
Abstract
Background
Early detection and management of malignant middle cerebral artery infarct (MMI) is clinically crucial, and many studies have investigated the predictors of MMI evolution. However, to date, little is known about MMI predictors in patients undergoing endovascular thrombectomy (ET). Therefore, this study attempts to investigate MMI predictors in these patients using a single center retrospective data.
Methods
Ninety-three patients treated with ET for anterior circulation stroke were analyzed. From pretreatment computed tomographic angiography (CTA), the collateral score was rated from 0 to 3 (0, 0% filling of the occluded territory; 1, >0% and ≤50% filling; 2, >50% and <100% filling; 3, 100% filling). The parenchymal hemorrhage and the size of the infarct were determined by gradient echo and diffusion-weighted magnetic resonance imaging performed 24 hours after the ET. Patients with and without MMI were compared with regard to demographic, clinical and radiological data. Using a multivariate logistic regression model, the independent predictors of MMI were confirmed.
Results
Nineteen patients (20.4%) developed MMI. There were no significant differences between patients with and without MMI with regard to the rate of vascular risk factors and recanalization failure. Taken together, poor collateral circulation (collateral score 0 or 1), an infarct size >2/3 middle cerebral artery territory, and type 2 parenchymal hemorrhage formed the significant independent predictor of MMI.
Conclusion
The collateral status based on pretreatment CTA independently predicts MMI evolution, and can, therefore, help early detection and management of MMI in patients undergoing ET.
INTRODUCTION
A large hemispheric infarct involving the middle cerebral artery (MCA) territory may deteriorate as a consequence of space-occupying cerebral edema. This leads to “malignant MCA infarct” (MMI).1 In cases of MMI with medical intensive care, the mortality rate amounts to ≤80%.1-3 However, if performed early, decompressive surgery dramatically reduces mortality and improves functional outcomes.4-6 Therefore, early detection of potential surgical candidates is clinically important in these patients.
Until now, many studies have reported different independent predictors for MMI evolution in patients with an MCA territory infarct.1,7-10 At present, infarct size is known to be the most reliable predictor.1,9,10 For this reason, the involvement of more than 2/3 or 1/2 of the MCA territory has been chosen as one of the inclusion criteria for decompressive surgery in randomized hemicraniectomy trials.4-6
However, little is known to date regarding the predictors of MMI evolution in patients undergoing endovascular thrombectomy (ET). In this study, therefore, we attempt to investigate variables associated with the occurrence of MMI in patients undergoing ET, using a retrospective data of a single comprehensive stroke center.
SUBJECTS AND METHODS
1. Study design and patients
Using the prospective ET registry from Soonchunhyang Cerebrovascular Center, we ascertained the names and registry numbers of 131 patients who were consecutively admitted to Soonchunhyang University Bucheon Hospital between January 2012 and July 2017. We then retrospectively reviewed their medical charts. From the 131 patients, we excluded 38 patients due to approach failure for thrombectomy (n=3), absence of pretreatment computed tomographic angiography (CTA) (n=12), no outcome data (n=8), and posterior circulation stroke (n=15). Finally, 93 patients with anterior circulation stroke were included in the analysis. This study was approved with waiver of informed consent by the Institutional Review Board of Soonchunhyang University Bucheon Hospital (SCHBC 2018-02-013).
2. Clinical and imaging assessment
Clinical information included the following: age, gender, hypertension, diabetes mellitus, hyperlipidemia, current smoking, prior stroke, ischemic heart disease, atrial fibrillation, previous history of antithrombotic and statin medications, initial blood pressure, onset-visit time, onset-procedure time, initial laboratory findings (blood glucose, white blood cell count, hemoglobin, platelet count), initial score of the National Institutes of Health Stroke Scale (NIHSS), lesion location, and use of intravenous tissue plasminogen activator (tPA).
All patients underwent pretreatment CTAs of the brain and neck, which were performed on a 128-detector high-definition CT scanner (Discovery CT750 HD; GE Healthcare, Milwaukee, WI, USA) using standardized protocol (section thickness, 0.625 mm; tube voltage, 100 kV; tube current, 200 mA). Images were scanned after a single bolus injection of 100 mL of nonionic contrast agent via an 18-gauge cannula placed in an antecubital vein. Images were obtained in series from the aortic arch to the vertex. Acquisitions were reconstructed into 10-mm-thick maximum intensity projection images of 5-mm intervals in the axial, sagittal, and coronal planes. Using maximum intensity projection images, collateral score (CS) was rated according to a previous study: score 0, representing absent collaterals (0% filling of the occluded territory); score 1, representing poor collaterals (>0% and ≤50% filling of the occluded territory); score 2, representing moderate collaterals (>50% and <100% filling of the occluded territory); score 3, representing good collaterals (100% filling of the occluded territory) (Fig. 1).11 For further analysis, the scores were dichotomized into two levels (scores of 0, 1 vs. 2, 3). The dichotomized evaluation had an excellent inter-rater agreement (kappa value 0.910; p<0.001).
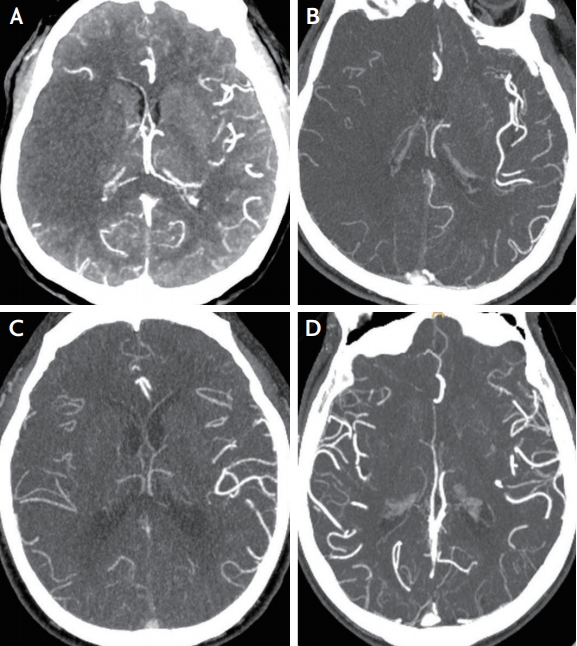
Example figures of collateral scores in the right middle cerebral artery territory infarct. Collateral score is rated as 0–3 using the maximum intensity projection image of computed tomographic angiography. (A) Score 0, representing absent collaterals (0% filling of the occluded territory). (B) Score 1, representing poor collaterals (>0% and ≤50% filling of the occluded territory). (C) Score 2, representing moderate collaterals (>50% and <100% filling of the occluded territory). (D) Score 3, representing good collaterals (100% filling of the occluded territory), in which the raters blind to clinical data cannot determine the laterality of collateral vessels.
The Alberta stroke program early CT score (ASPECTS) was counted using CTA source images (CTA-SIs) which were adjusted to have maximum contrast between normal and abnormal sides.12 All images were analyzed separately by two investigators (S.J.L. and H.J.K.). In the event of different scores on CS and ASPECTS, a final decision was arrived at by a consensus of the two.
All participants underwent ET using stent retrievers (Solitare in 88 cases, Trevo in four cases, and Solitare+Trevo in one case). Recanalization on catheter angiography was graded according to the thrombolysis in cerebral infarction (TICI) perfusion scale.13 Failure of recanalization during ET procedure was defined as a final TICI grade of 0–2a. The Trial of Org 10172 in Acute Stroke Treatment subtype classification system was used to classify all the strokes.14
Parenchymal hemorrhage (PH) and infarct size were determined by gradient echo and diffusion-weighted magnetic resonance imaging (MRI) performed 24 hours after ET. PH was defined as a coagulum with mass effect, and classified into PH1 (≤30% of infarct area with mild space-occupying effect) and PH2 (>30% of infarct area with significant space-occupying effect, or clot remote from infarct area).15 Infarct size was categorized into <1/3, 1/3-2/3, or >2/3 of MCA territory.
3. Outcomes
MMI was defined as follows: 1) NIHSS >18 and a level of consciousness of ≥1 on item 1a of the NIHSS either on admission or after secondary deterioration; 2) large space-occupying infarct on follow-up MRI or CT of at least two-thirds of the MCA territory with compression of ventricles or midline shift; and 3) no other obvious cause of neurologic deterioration.16 The 6-month modified Rankin scale (mRS) was documented in the follow-up clinic note by a neurologist or neurosurgeon. Scores of ≥3 in 6-month mRS were considered to be poor outcomes.
4. Statistical analysis
SPSS software, version 21.0 (SPSS Inc., Chicago, IL, USA) was used to perform statistical analyses. The independent t-test (or Mann-Whitney U test) or chi-square test (or Fisher’s exact test) was used to compare the difference between patients with and without MMI evolution. According to the results of Shapiro-Wilk normality test, time variables, NIHSS, and CTA-SI ASPECTS were analyzed by Mann-Whitney U test. Multivariate logistic regression analyses were done for pretreatment and then for pre- and post-treatment variables together in order to confirm the predictors associated with MMI evolution. Variables with univariate p value <0.1 were included in the multivariate analysis. An odds ratio (OR), and a 95% confidence interval (CI) were obtained. p-values <0.05 were considered to be statistically significant.
RESULTS
The mean age of the 93 patients (51 men and 42 women) included in the analysis was 69.8 years (range, 32–92) at admission. Nineteen of these patients (20.4%) developed MMI. Table 1 shows the comparison between patients with and without MMI evolution in terms of pretreatment clinical features. The MMI group tended to be older, and had a significantly lower CS and CTASI ASPECTS than the non-MMI group. When age, CS (0, 1 vs. 2, 3), and CTA-SI ASPECTS were included in multivariate logistic regression model, CS alone was the significant predictor of MMI among pretreatment variables (p=0.002; OR, 18.767; 95% CI, 2.956–119.132).
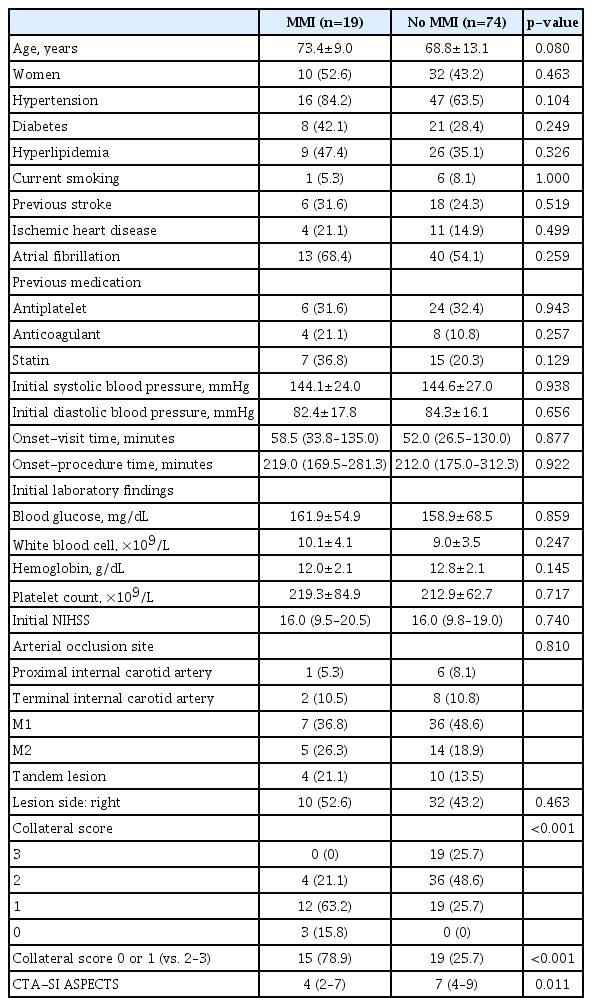
Comparison of pretreatment clinical features between patients with and without MMI
The MMI and non-MMI groups were compared with regard to post-treatment variables (Table 2). The presence of PH2 and a larger infarct size were significantly associated with MMI, while no use of tPA and failure of recanalization had only a statistical trend toward MMI evolution (p<0.1). Further, the MMI group had a significantly higher rate of poor outcome than the non-MMI group. Multivariate logistic regression was performed using variables of univariate p<0.1 (age, poor collateral [CS 0 or 1], CTA-SI ASPECTS, no tPA use, recanalization failure, infarct size >2/3 MCA territory, and PH2). The analysis showed that CS 0 or 1, together with infarct size >2/3 MCA and PH2 was a significant independent predictor of MMI (Table 3). Additionally, a low CS was very closely associated with a larger infarct size (18 of 34 patients [52.9%] with CS 0 or 1 had an infarct involving >2/3 of MCA territory while seven of 59 patients [11.9%] with CS 2 or 3 had the same infarct size; p<0.001) and poor outcome (28/34 [82.4%] vs. 29/59 [49.2%] had poor outcomes; p=0.002).

Comparison of post-treatment features between patients with and without MMI
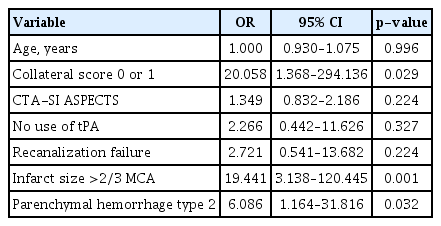
Mulivariate logistic regression for malignant middle cerebral artery infarct evolution
DISCUSSION
In this study, poor collateral status in pretreatment was the independent predictor of MMI evolution in patients undergoing ET. In terms of the pathogenic mechanism of ischemic stroke evolution the result is plausible. Patients deficient in collaterals are more likely to experience a severe ischemia around the initial infarct core and a further flow stasis distal to the original thrombus, and these factors lead to a faster pretreatment growth of unsalvageable brain tissue.17-20 Despite ET, a baseline larger infarct can put the patients at risk for MMI, and thus poor outcomes can occur. The explanation can be supported by our results that poor collateral status was closely associated with a larger infarct size measured 24 hours after ET. In the same context, the multivariate analysis did not show that the presence or absence of recanalization during the ET procedure was associated with the evolution of MMI. The benefit of recanalization would be limited in patients deficient in collaterals who, in the pretreatment stage, already had a large infarct.21
Indeed, few reports have investigated the predictors of MMI in patients undergoing ET.22,23 A study showed that CTA-SI ASPECTS was an independent predictor of MMI in a model that did not include collateral status.22 In fact, CTA-SI ASPECTS may reflect abnormalities of cerebral blood volume at tissue level. Thus it may correspond to final infarct volume and clinical outcomes .12 However, in our study, CTA-SI ASPECTS was only a univariate predictor of MMI, but it lost its association when collateral status was added in the model. Another study analyzing 81 patients considered for reperfusion therapy had results similar to ours, demonstrating that poor collateral circulation predicts MMI evolution, but in the analysis, only 53 patients (64.6% of total patients) with ET were included.23 Furthermore, our study made adjustments for post-treatment powerful predictors of MMI, infarct size and PH2, which were not included in the previous analyses.22,23
In particular, our results are in agreement with the recent secondary analyses from data of randomized controlled trials, which suggested that baseline collateral status on CTA is a robust determinant of clinical outcomes in patients undergoing ET.18,24 Thus, the treatment benefit may be absent in patients with poor collateral circulation.18,24,25 Based on the study results, an updated guideline recommended pretreatment collateral flow status as a factor that can be taken into consideration for clinical decision-making to determine eligibility for ET.26 Therefore, our real-world data, together with previous results, add weight to the clinical implication of baseline collateral status in those patients. It also helps to strengthen eligibility criteria for selecting ET candidates, and it further contributes to early identification of candidates for neuro-intensive care and decompressive surgery.
However, this study has some limitations. Above all, it was based on single center data, which might lead to selection bias. In addition, the cohort consists of a small number of patients, and this only permits a limited statistical power. Thus, the results may not be applicable to other stroke populations or treatment settings. A further larger-scale study is needed to confirm these results. Besides, the infarct size was not measured by volumetric assessment. Using only a visual analysis of a diffusion-weighted MRI, the infarct size was estimated and categorized into three levels.
Conclusively, the pretreatment collateral status, simply scored by CTA, independently predicts MMI evolution, and thus can help in the early detection and management of MMI in patients undergoing ET.
Acknowledgements
We thank Dr. Bum-Tae Kim, Dong-Seong Shin, and Jong-Hyun Park for their endovascular treatments.
Notes
Conflicts of Interest
No potential conflicts of interest relevant to this article was reported.